Saturday, July 14, 2018

ANTILOG_14July18a

###

ANTILOG_14July18a

###

09:15 2018-07-14

- As I have repeated ceaselessly, I started an interdisciplinary art-research project called The History-Project, in the Summer of 2001; Here I will show two of the first "History-Paintings" that I made that summer, and will explain some aspects of the paintings;
First History-Painting. A.G. (c) 2001-2018. All Rights Reserved.
 - Again, this was essentially the FIRST History-Painting that I made; There are three main features that make it a History-Painting in my book; One is the "Templates", that are just polygons, "faces" if you will, that function like "windows" into History;
- The point of these early History-Paintings was to "paint the concept(s) of History", and this is an example of what I got;
Showing Templates in History-Painting. A.G. (c) 2001-2018. All Rights Reserved.
- The painting also contains what I call "axes"; I found it important that my History-Paintings have Axes; It makes it so that it resembles a kind of "graph"; At the very least, that's one of the effects I was going for; So the History-Painting has Templates as well as Axes;
Showing Axes in History-Painting. A.G. (c) 2001-2018. All Rights Reserved.
- The Axes are supposed to hold the whole thing together; But it's important to know that BETWEEN the templates and amongst the Axes and so forth, there are "lines" if you will, that function as what I call CONDUITS; The Conduits are super important in the concept of History; The Templates too are important, as well as the Axes, as basic features of History-Paintings, but the Conduits are what puts it all together as a whole;
Showing Conduits in History-Painting. A.G. (c) 2001-2018. All Rights Reserved.
- I made another painting in the same period; The previous painting was mixed media on cardboard; The next painting, one of the first "official" History-Paintings was made with acrylic on canvas;
History-Painting. A.G. (c) 2001-2018. All Rights Reserved.
- This painting has the same features, the Templates, the Axes, and the Conduits, and I would go on to make over a hundred paintings like these;
Showing Templates in History-Painting. A.G. (c) 2001-2018. All Rights Reserved.
- The Templates are of utmost importance in all of my paintings in this style; They stand for "abstract objects", or abstract "structures"; They could be seen and treated as "data types" if you wanted to; They are important in History, in the historical discourse, to me they stand for People, Places, and Things;
Showing Axes in History-Painting. A.G. (c) 2001-2018. All Rights Reserved.
- Here we have the Axes, as before; These are like "basis vectors", making this a Cartesian coordinate plane, for that's how I envisioned the History-Painting in the 21st century, as a form of graphic communication; Next of course, as before, we have the conduits, and these features are present in over a hundred paintings and drawings I made since the Summer of 2001;
Showing Conduits in History-Painting. A.G. (c) 2001-2018. All Rights Reserved.
- The "Conduits" are like "communication lines", they are part of what makes these paintings look like Motherboards; That was also the point, I was playing with the "aesthetic" if you will of Integrated Circuits; To me integrated circuits, visually at least, make me think of History, of the concept(s) of History, which is what I was trying to paint back then;
- More to come...

Monday, July 9, 2018

ANTILOG_09July18a

###

ANTILOG_09July18a

###

12:56 2018-07-09

- As part of the WHITE POINT PROJECT, I worked on what is called the "Daylight Series", that is the palette of color temperatures of sunlight/daylight;
Color Temperature Palette. A.G. (c) 2018. All Rights Reserved.
- The idea is that sunlight or daylight has a "color" to it, which influences everything literally "under the sun"; As you can see in the following picture, I have made the landscape on the left "warmer" by adjusting the colors; The landscape on the right is therefore "cooler";
Warm vs. Cool colors. A.G. (c) 2018. All Rights Reserved.
- A great way to show the difference is to work with grays; Here we have two instances of gray, and the one on the left is meant to be once again "warmer" than the one on the right;
Warm vs. Cool Gray. A.G. (c) 2018. All Rights Reserved.
- The fact that the daylight series affects everything "under the sun" means that any landscape or other picture taken under the sun will have a kind of "color harmony" to it, it will have a "balanced" palette, because daylight is influencing all the other colors equally.

Sunday, July 8, 2018

ANTILOG_08July18a

###

ANTILOG_08July18a

###

16:57 2018-07-08

- Yesterday, I ran a simple experiment with digital images and was looking at their sizes in terms of kilobytes; I started with a picture that was all white pixels and compared it to a picture that was Gaussian noise; As predicted, the file size for the Gaussian noise was greater than the file size for the all-white-pixels image;
- A few things weren't clear to me yesterday, but I have since done a little research; The images are bigger in terms of bytes than the number of actual bytes or bits that it takes to encode the image; this is because image formats have headers and other metadata, so you end up with a file that is bigger than the theoretical number of bits needed to encode all the pixels with their respective pixel values;
- A standard grayscale image with 256 levels for each pixel requires 8 bits per pixel; An n-bit pixel can take on 2n different values;
Non-monochrome Gaussian noise at 254 kilobytes. A.G. (c) 2018. All Rights Reserved.
- What I was trying to get at was that an image with randomly selected pixel values will be harder to "compress" than an image where there is a lot of "redundancy"; That is to say, the image which has ALL WHITE PIXELS is easy to specific, i.e. a 256 pixel by 256 pixel image with only white pixels could be specified as "W65536", only six characters, the color and the number of pixels with that same value;
- SEE: "Run-length encoding (RLE) is a very simple form of lossless data compression in which runs of data (that is, sequences in which the same data value occurs in many consecutive data elements) are stored as a single data value and count, rather than as the original run.";
- SEE ALSO: "In algorithmic information theory (a subfield of computer science and mathematics), the Kolmogorov complexity of an object, such as a piece of text, is the length of the shortest computer program (in a predetermined programming language) that produces the object as output. It is a measure of the computational resources needed to specify the object, and is also known as descriptive complexity, Kolmogorov–Chaitin complexity, algorithmic complexity, algorithmic entropy, or program-size complexity.";
- So in a sense I was thinking of the "complexity" of the underlying image, and that's what I'm trying to get at; My value of "visual interestingness" or "VI" for short, has something to do with complexity; I'm not yet sure exactly what the correlation is, but I'm working on it, it also has to do with information entropy or "surprisal";
- "Noisy" images have more of an element of surprise, or "uncertainty" if you want to call it that; For VI to occur, you need a certain level of uncertainty, or it will be too redundant, and therefore not with much VI; just like an all-white-pixel image is not "beautiful", it's too simple, it has a very low VI value; But then pure Gaussian noise also has a low VI value, because it's just pure noise; So the magic VI spot is somewhere in the middle, and these visual experiments are all meant to get to a working definition of visual interestingness that can be used to generate visually interesting images algorithmically, or what is called "computational creativity";
Gaussian noise, 109 kilobytes. A.G. (c) 2018. All Rights Reserved.
- "BIT DEPTH is determined by the number of bits used to define each pixel. The greater the bit depth, the greater the number of tones (grayscale or color) that can be represented. Digital images may be produced in black and white (bitonal), grayscale, or color. A bitonal image is represented by pixels consisting of 1 bit each, which can represent two tones (typically black and white), using the values 0 for black and 1 for white or vice versa. A grayscale image is composed of pixels represented by multiple bits of information, typically ranging from 2 to 8 bits or more.";
- "The most predictable image is a large rectangle in a single color. In other words, a scaled-up version of the one-pixel images I discussed in part one. An empty canvas, if you want. A blank sheet. Compression algorithms should be really good at compressing an image where every pixel is the same color. It’s the best-case scenario, the ultimate in predictability – once you’ve seen the first pixel, you’ve seen them all.".

Saturday, July 7, 2018

ANTILOG_07July18a

###

ANTILOG_07July18a

###

15:22 2018-07-07

- I just did an experiment; I wanted to see what the correlation was between the configuration of pixel values of a digital image and its size in kilobytes; I created an image that is ALL WHITE, i.e. every pixel has the same value, white, and it is 2.34 kilobytes:
All White. 2.34 kilobytes. A.G. (c) 2018. All Rights Reserved.
- The image is all white pixels and is 256 pixels wide by 256 pixels high; That means that there are 65,536 pixels in all, which can have a value between 0 and 256;
- I made another 256 pixel by 256 pixel image but with Gaussian white noise, which is 98.6 kilobytes:
Gaussian white noise. 98.6 kilobytes. A.G. (c) 2018. All Rights Reserved.
- So random pixels makes a digital file that is much bigger, heavier, than an image where all the pixels are the same; I made another experience, I made bigger pixels:
Large Pixels, random. 12.4 kilobytes. A.G. (c) 2018. All Rights Reserved.
- Here we see that if I reduce the number of "random" pixels to a smaller number, with bigger pixels, the same 256 px by 256 px image is only 12.4 kilobytes; Technically speaking, if it was really a bitonal image, with ONLY completely WHITE pixels OR ONLY completely BLACK pixels, for different combinations of black and white pixels in a bitonal image, each pixel would be worth roughly 1-bit, because it's a simple decision between two possible values, which is 1-bit at the minimum; These images are in JPEG and I think JPEG is supposed to use compression, I'm not sure, I would have to look it up; I still don't know why an all-white image is 2.34 kilobytes, which is 1000 bytes per kilobyte:
Random black and white large pixels, 2.85 kilobytes. A.G. (c) 2018. All Rights Reserved.
- Here you can see that a bitonal image with large black pixels is 2.85 kilobytes; compare it to the all-white image, which was 2.34 kilobytes; I'm surprised that these images are so large, technically it would take less bytes than that, at least in my conception; there are only 256 pixels by 256 pixels, with 256 possible values for each pixel; The image with Gaussian noise was 98.6 kilobytes, so for 65,536 pixels, that's roughly 1.5 bytes per pixel; one byte is 8 bits representing a binary number;
- In any case, the last image is a one-bit bi-tonal black-and-white image which, in the context of computer imaging, is an image with only two colors: black and white (also called bilevel or binary images); This kind of image seems to take less storage space; I'm going to have to investigate this further to know why an all-white-pixel image can have so many bytes in JPEG format;
- In any case, the main idea here was that random pixels in greyscale is harder to compress, you get an image which is "heavier" in terms of kilobytes in storage, because the randomness cannot really be compressed, whereas an all-white-pixel image is easy to compress since it's just one pixel value for every pixel, i.e. it has very high "redundancy", which is key in its "lightness" in terms of kilobytes.
* * *
15:50 2018-07-07

- Another experiment I did was with what is called "stochastic resonance", something that one finds in image processing, amongst other places;
- Basically the idea is that I took an image, here it is the image in the top-left corner, and I used a "threshold" function on it, to give the image at the top-right; The idea is that the threshold function just takes greyscale pixel values and at a decided value, i.e. the "threshold", it decides whether each pixel is above or below that value and so changes the pixel values for the entire image based on the threshold; The result is a black and white "binary image"; pixel values below the threshold turn to white, and those above it turn to black, I think that's how it works;
- In the image on the bottom-left, I added Gaussian noise, and then in the image on the bottom-right, I used the same threshold function; Notice that there is more detail, adding noise to the "signal" before the function gave an image with much more detail; That's a result of stochastic resonance; Here is the image it gives, and I hope this all made sense to you, dear readers:
Experiment with stochastic resonance. A.G. (c) 2018. All Rights Reserved.
- The noise changes the way the threshold function functions; You get a different result; I think that adding noise to signals can make huge differences; In my sound design I'm always adding noise because in real life there is always noise, so for me for digital music to sound like real music, it requires some noise, just to make it sound natural, like things sound in real life.

Wednesday, July 4, 2018

ANTILOG_04July18b

###

ANTILOG_04July18b

###

15:20 2018-07-04

- It might not be obvious to everyone, but I'm a big fan of NOISE; I love all things that have to do with NOISE; I just love NOISE!;
- I've also done countless experiments with noise; I like to think of myself as a philosopher or maybe even a psychologist of noise; That is, I study the effects that noise has on people;
- Most people seem to have a fear of ambiguity built-in, like they don't like ambiguity, they will shy away from it, similar to how some people have a fear of asymmetry; This happens with noise, people don't generally like noise, they try to get rid of it, it's "unwanted";
- Here I present a series of experiments using graphs of noise, of random walks actually, that I revamped into a kind of mountain-range-looking design; This is entirely done digitally with simple image processing functions, I believe a computer could generate this kind of image autonomously given the right rule-base that would be hard-coded into the "noise engine" if you will; First example:
WHITE CASTLE: The Noise's Edge. A.G. (c) 2018. All Rights Reserved.
- Basically, I just took three different graphs of random walks, reshaped them to fit in the same image space, and superimposed them; I just changed the contrast and luminosity and opacity to make the design you see above; I also made some more "colorful" ones;
NOISE FIELD. A.G. (c) 2018. All Rights Reserved.
- The concept of "the noise's edge" is important, because it's similar to what they call the "edge of chaos"; It's a similar concept, it's just the "edge of noise"; It's essentially the same thing, though, so there's no reason to get confused;
- The edge of noise is just the transition space between "signal" and "noise", i.e. it's not entirely "signal" and not entirely "noise"; One way to put it would be to say it is the "antisignal", which is a concept I've often used, but won't get into just yet; SEE: What is (an) Antisignal?;
THE NOISE'S EDGE redux. A.G. (c) 2018. All Rights Reserved.
- The idea is to take a piece of noise and transform it into something that is visually "interesting"; I am often trying to measure a kind of quality you could call "interestingness"; I think that something that starts as noise and is modulated carefully through various steps, comes to attain a certain level of "visual interestingness" at some point; It just requires that you modulate the noise until you start getting shapes; And the "seed noises" that I use are often just plain pure white noise; The random walks that I started with her were in graphic form, for example:
Noisy random walk. From Google Image Search.
- That's the "edge" that I'm talking about, the peaks and valleys of this stochastic process; There is nothing to fear from the technical term "stochastic", it just means it's a random process, basically; it just means it's random or randomly determined, such as a "stochastic procedure" or whatnot; I happen to find such graphs highly beautiful, I love the way the peaks and valleys look, so I just copied it and turned it into a "random dark forest" if you will, or "random mountain chain", a kind of "NOISE RIDGE";
NOISE RIDGE. A.G. (c) 2018. All Rights Reserved.
- I have been obsessed with NOISE all my life; There are forms of "perceptual" noises that occur sometimes in life, like a kind of "brain fog", where the image on the retina seems "foggy" or "ambiguous", "clouded", etc.;
- I've done so many experiments with noise in with Sound(s), with Image(s), and even with Text (I wrote cut-up novels which were generated algorithmically using an as-yet undisclosed methodology;
- Here is an example of something similar to the above that I did in 2015; I just took "noisy signals" in graphic form and superimposed them, then added some color to the sky and so forth; In this case the idea was to imitate the "skyline" of a contemporary city;
Night in The City. A.G. (c) 2015-2018. All Rights Reserved.

- There's so much that you can do with noise, I really wish I could get people on my NOISE FRENZY BANDWAGON, but alas, noise is not for everyone's taste, i.e. is not everyone's cup of tea.

ANTILOG_04July18a

###

ANTILOG_04July18a

###

11:11 2018-07-04

- I am still thinking about my experiments in The White Point Project; I think that the concept of "infinitesimal colors" is robust; They are colors that are "offwhite" but infinitesimally so;
- I found this image from previous White Point experiments; What I did was paint a canvas with various "white washes" and then photographed the piece of cardboard under different lighting conditions; This was the result, it gave me four different "values";
DAYLIGHT SERIES / WHITE POINT. A.G. (c) 2018. All Rights Reserved.
- I will continue doing experiments like this; The goal is to have actual data, to generate my own datasets on subjects like this, color values and so forth, the nature and quality of "light" under different conditions, how canvasses behave and so forth;
- Part of it has to do with the human retina, in that regard what I am doing are valid experiments in the psychophysics of human sight; This work can easily get phenomenological, and perhaps I should undertake a proper phenomenological investigation into the White Point Series;
- Remember that I began my Official Declaration of Production-Year 2019-2020; Remember to check that out for it is an evolving document; I will keep on working on it until about September or October, when I will leave it as a type of "constitution" document for the coming Production-Year, a constitution I will follow to a tee, that is how I build my brand value, by making predictions on my production that can be measured; I give stakeholders forward-looking statements on my artistic production; Remember that predictable economics are always better than unpredictable economics; People who invest in me as an artist need predictable economics; That's partly what differentiates me from other artists; I tell it like it is, I make statements about my production and my "Production-Year" and I do exactly what I say;
- I have many other projects on the go: The Critique of Code Genres, The Internals Project, The Refcards Project, The Stacks Project, The New Documentation Project, The Theatre Pauvre Project, The White Point Project, The Writing-Without-Writing Project, as well of course as The History-Project which still continues after 17 years, and The Archives-Project.
Writing-Without-Writing circa 2007. A.G. (c) 2007-2018. All Rights Reserved.

Monday, July 2, 2018

ANTILOG_02July18a

###

ANTILOG_02July18a

###

20:25 2018-07-02

- As I have mentioned a hundred times, in the Summer of 2001, I began an interdisciplinary art-research project called The History-Project;
- This project began with a series of paintings which I called "History-Paintings"; The idea was that I was "reinventing" the historical painting genre for the 21st century;
- I asked myself, What would the historical painting look like in 2001?; I then decided that I would "paint the concept(s) of History";
- So that was the basic premise of the project, to paint the concept(s) of History;
- The very first painting I made in this new genre was...
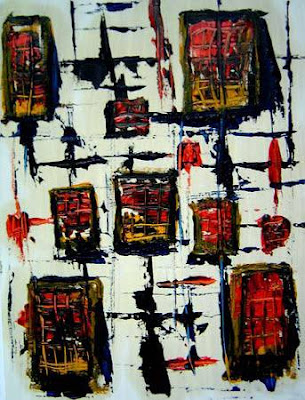
History-Painting circa 2001. A.G. (c) 2018. All Rights Reserved.
- So that was what I came up with in the Summer of 2001, as the painting of the "concept(s) of History"; But more recently, in fact a couple of days ago, I came up with another sample of what "history" could look like, in this case a form of PATINA, of an aged and distressed SURFACE;
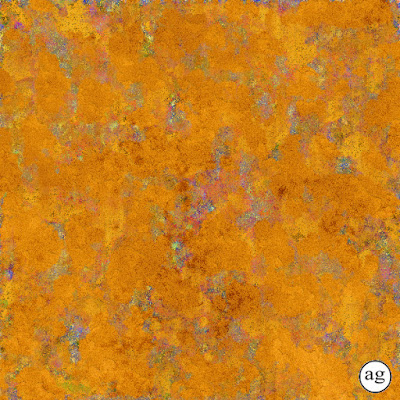
SUNBURST. A.G. (c) 2018. All Rights Reserved.
- So in this case we have a "weathered" surface or "texture", a synthetic texture to be sure, designed entirely by digital means;
- Now what I am thinking about the History-Painting is a kind of graphic mixing random walks with an arrow of general direction;
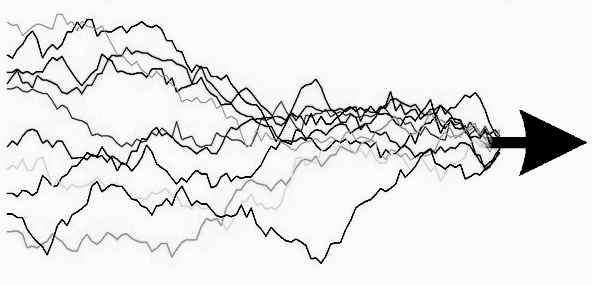
Arrow of Time. A.G. (c) 2018. All Rights Reserved.
- The idea is that "history" moves forward, it hedges up forwards, it never looks back; All representations of the concept(s) of HISTORY have to be forward-heading; That's what I realize now at this late stage. More to come...